Revision 1
#42022
Store at -20C
Insulin/IGF-1 Signaling Pathway Antibody Sampler Kit
1 Kit
(9 x 20 microliters)
877-616-CELL (2355)
877-678-TECH (8324)
3 Trask Lane | Danvers | Massachusetts | 01923 | USA
For Research Use Only. Not for Use in Diagnostic Procedures.
| Product Includes | Product # | Quantity | Mol. Wt | Isotype/Source |
|---|---|---|---|---|
| Insulin Receptor β (4B8) Rabbit mAb | 3025 | 20 µl | 95 kDa | Rabbit IgG |
| IGF-I Receptor β (D23H3) XP® Rabbit mAb | 9750 | 20 µl | 95 kDa | Rabbit IgG |
| Phospho-IGF-I Receptor β (Tyr1131)/Insulin Receptor β (Tyr1146) Antibody | 3021 | 20 µl | 95 kDa | Rabbit |
| Phospho-Akt (Ser473) (D9E) XP® Rabbit mAb | 4060 | 20 µl | 60 kDa | Rabbit IgG |
| Phospho-Akt (Thr308) (D25E6) XP® Rabbit mAb | 13038 | 20 µl | 60 kDa | Rabbit IgG |
| Phospho-GSK-3β (Ser9) (D85E12) XP® Rabbit mAb | 5558 | 20 µl | 46 kDa | Rabbit IgG |
| Phospho-FoxO1 (Thr24)/FoxO3a (Thr32)/FoxO4 (Thr28) (4G6) Rabbit mAb | 2599 | 20 µl | 65, 78 to 82, 95 kDa | Rabbit |
| Phospho-mTOR (Ser2448) (D9C2) XP® Rabbit mAb | 5536 | 20 µl | 289 kDa | Rabbit IgG |
| Phospho-Tuberin/TSC2 (Ser939) Antibody | 3615 | 20 µl | 200 kDa | Rabbit |
| Anti-rabbit IgG, HRP-linked Antibody | 7074 | 100 µl | Goat |
Please visit cellsignal.com for individual component applications, species cross-reactivity, dilutions, protocols, and additional product information.
Description
The Insulin/IGF-1 Signaling Pathway Antibody Sampler Kit provides an economical means of detecting select components involved in the insulin and/or IGF-1 signaling pathways. The kit contains enough primary antibodies to perform at least two western blot experiments per antibody.
Storage
Background
Insulin and IGF-1 act on two closely related tyrosine kinase receptors to initiate a cascade of signaling events. These signaling events activate a variety of biological molecules, including kinases and transcription factors, which regulate cell growth, survival and metabolism.
Type I insulin-like growth factor receptor (IGF-IR) is a transmembrane receptor tyrosine kinase that is widely expressed in many cell lines and cell types within fetal and postnatal tissues (1-3). Three tyrosine residues within the kinase domain (Tyr1131, Tyr1135, and Tyr1136) are the earliest major autophosphorylation sites (4). Phosphorylation of these three tyrosine residues is necessary for kinase activation (5,6). Insulin receptors (IRs) share significant structural and functional similarity with IGF-I receptors, including the presence of an equivalent tyrosine cluster (Tyr1146/1150/1151) within the kinase domain activation loop. Tyrosine autophosphorylation of IRs is one of the earliest cellular responses to insulin stimulation (7). Autophosphorylation begins with phosphorylation at Tyr1146 and either Tyr1150 or Tyr1151, while full kinase activation requires triple tyrosine phosphorylation (8).
Akt, also referred to as PKB or Rac, plays a critical role in controlling survival and apoptosis (9-11). This protein kinase is activated by insulin and various growth and survival factors to function in a wortmannin-sensitive pathway involving PI3 kinase (10,11). Akt is activated by phospholipid binding and activation loop phosphorylation at Thr308 by PDK1 (12) and by phosphorylation within the carboxy terminus at Ser473. The previously elusive PDK2 responsible for phosphorylation of Akt at Ser473 has been identified as mammalian target of rapamycin (mTOR) in a rapamycin-insensitive complex with rictor and Sin1 (13,14).
Tuberin is a product of the TSC2 tumor suppressor gene and an important regulator of cell proliferation and tumor development (15). Tuberin is phosphorylated on Ser939 and Thr1462 in response to PI3K activation and the human TSC complex is a direct biochemical target of the PI3K/Akt pathway (16). This result complements Drosophila genetics studies suggesting the possible involvement of the tuberin-hamartin complex in the PI3K/Akt mediated insulin pathway (17-19).
The mammalian target of rapamycin (mTOR, FRAP, RAFT) is a Ser/Thr protein kinase (20-22) that functions as an ATP and amino acid sensor to balance nutrient availability and cell growth (23,24). When sufficient nutrients are available, mTOR responds to a phosphatidic acid-mediated signal to transmit a positive signal to p70 S6 kinase and participate in the inactivation of the eIF4E inhibitor, 4E-BP1 (25). These events result in the translation of specific mRNA subpopulations. mTOR is phosphorylated at Ser2448 via the PI3 kinase/Akt signaling pathway and autophosphorylated at Ser2481 (26,27).
The Forkhead family of transcription factors is involved in tumorigenesis of rhabdomyosarcoma and acute leukemias (28-30). Within the family, three members (FoxO1, FoxO4, and FoxO3a) have sequence similarity to the nematode orthologue DAF-16, which mediates signaling via a pathway involving IGFR1, PI3K, and Akt (31-33). Active forkhead members act as tumor suppressors by promoting cell cycle arrest and apoptosis. Increased proliferation results when forkhead transcription factors are inactivated through phosphorylation by Akt at Thr24, Ser256, and Ser319, which results in nuclear export and inhibition of transcription factor activity (34).
Glycogen synthase kinase-3 (GSK-3) was initially identified as an enzyme that regulates glycogen synthesis in response to insulin (35). GSK-3 is a critical downstream element of the PI3K/Akt cell survival pathway whose activity can be inhibited by Akt-mediated phosphorylation at Ser21 of GSK-3α and Ser9 of GSK-3β (36,37).
Background References
- Adams, T.E. et al. (2000) Cell Mol Life Sci 57, 1050-93.
- Baserga, R. (2000) Oncogene 19, 5574-81.
- Scheidegger, K.J. et al. (2000) J Biol Chem 275, 38921-8.
- Hernández-Sánchez, C. et al. (1995) J Biol Chem 270, 29176-81.
- Lopaczynski, W. et al. (2000) Biochem Biophys Res Commun 279, 955-60.
- Baserga, R. (1999) Exp Cell Res 253, 1-6.
- White, M.F. et al. (1985) J Biol Chem 260, 9470-8.
- White, M.F. et al. (1988) J Biol Chem 263, 2969-80.
- Franke, T.F. et al. (1997) Cell 88, 435-7.
- Burgering, B.M. and Coffer, P.J. (1995) Nature 376, 599-602.
- Franke, T.F. et al. (1995) Cell 81, 727-36.
- Alessi, D.R. et al. (1996) EMBO J 15, 6541-51.
- Sarbassov, D.D. et al. (2005) Science 307, 1098-101.
- Jacinto, E. et al. (2006) Cell 127, 125-37.
- Soucek, T. et al. (1998) Proc Natl Acad Sci U S A 95, 15653-8.
- Manning, B.D. et al. (2002) Mol Cell 10, 151-62.
- Gao, X. and Pan, D. (2001) Genes Dev 15, 1383-92.
- Potter, C.J. et al. (2001) Cell 105, 357-68.
- Tapon, N. et al. (2001) Cell 105, 345-55.
- Sabers, C.J. et al. (1995) J Biol Chem 270, 815-22.
- Brown, E.J. et al. (1994) Nature 369, 756-8.
- Sabatini, D.M. et al. (1994) Cell 78, 35-43.
- Gingras, A.C. et al. (2001) Genes Dev 15, 807-26.
- Dennis, P.B. et al. (2001) Science 294, 1102-5.
- Fang, Y. et al. (2001) Science 294, 1942-5.
- Navé, B.T. et al. (1999) Biochem J 344 Pt 2, 427-31.
- Peterson, R.T. et al. (2000) J Biol Chem 275, 7416-23.
- Anderson, M.J. et al. (1998) Genomics 47, 187-99.
- Galili, N. et al. (1993) Nat Genet 5, 230-5.
- Borkhardt, A. et al. (1997) Oncogene 14, 195-202.
- Nakae, J. et al. (1999) J Biol Chem 274, 15982-5.
- Rena, G. et al. (1999) J Biol Chem 274, 17179-83.
- Guo, S. et al. (1999) J Biol Chem 274, 17184-92.
- Arden, K.C. (2004) Mol Cell 14, 416-8.
- Welsh, G.I. et al. (1996) Trends Cell Biol 6, 274-9.
- Srivastava, A.K. and Pandey, S.K. (1998) Mol Cell Biochem 182, 135-41.
- Cross, D.A. et al. Nature 378, 785-9.
Trademarks and Patents
Cell Signaling Technology is a trademark of Cell Signaling Technology, Inc.
Alexa Fluor is a registered trademark of Life Technologies Corporation.
All other trademarks are the property of their respective owners. Visit cellsignal.com/trademarks for more information.
Limited Uses
Except as otherwise expressly agreed in a writing signed by a legally authorized representative of CST, the following terms apply to Products provided by CST, its affiliates or its distributors. Any Customer's terms and conditions that are in addition to, or different from, those contained herein, unless separately accepted in writing by a legally authorized representative of CST, are rejected and are of no force or effect.
Products are labeled with For Research Use Only or a similar labeling statement and have not been approved, cleared, or licensed by the FDA or other regulatory foreign or domestic entity, for any purpose. Customer shall not use any Product for any diagnostic or therapeutic purpose, or otherwise in any manner that conflicts with its labeling statement. Products sold or licensed by CST are provided for Customer as the end-user and solely for research and development uses. Any use of Product for diagnostic, prophylactic or therapeutic purposes, or any purchase of Product for resale (alone or as a component) or other commercial purpose, requires a separate license from CST. Customer shall (a) not sell, license, loan, donate or otherwise transfer or make available any Product to any third party, whether alone or in combination with other materials, or use the Products to manufacture any commercial products, (b) not copy, modify, reverse engineer, decompile, disassemble or otherwise attempt to discover the underlying structure or technology of the Products, or use the Products for the purpose of developing any products or services that would compete with CST products or services, (c) not alter or remove from the Products any trademarks, trade names, logos, patent or copyright notices or markings, (d) use the Products solely in accordance with CST Product Terms of Sale and any applicable documentation, and (e) comply with any license, terms of service or similar agreement with respect to any third party products or services used by Customer in connection with the Products.
Revision 1
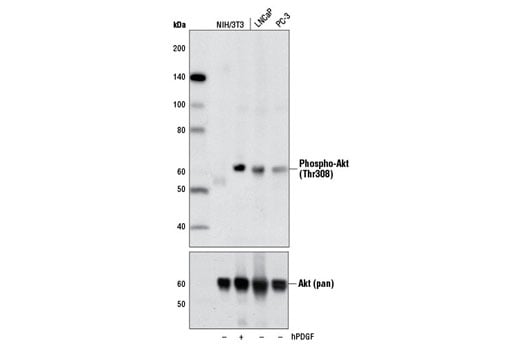
Western blot analysis of extracts from NIH/3T3 cells, untreated (-) or treated with Human Platelet-Derived Growth Factor AA (hPDGF-AA) #8913 (100 ng/ml, 5 min; +), and untreated (-) LNCaP and PC-3 cells, using Phospho-Akt (Thr308) (D25E6) XP® Rabbit mAb (upper) or Akt (pan) (C67E7) Rabbit mAb #4691 (lower).
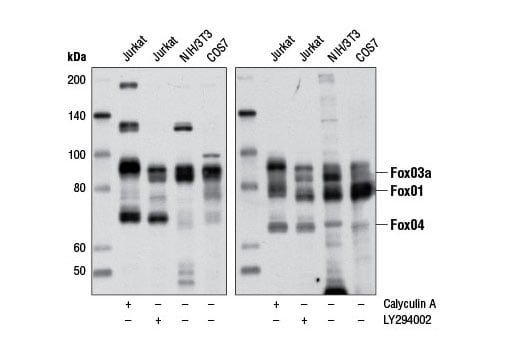
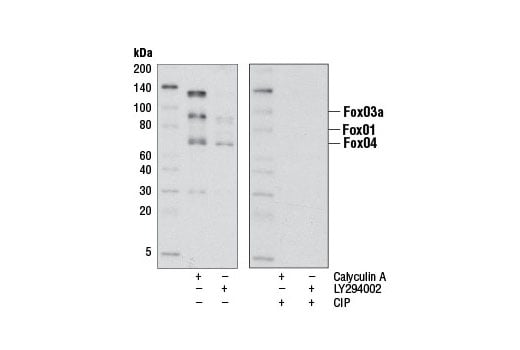
Western blot analysis of extracts from Jurkat cells treated with either Calyculin A (#9902) or LY294002 (#9901), NIH3T3 and COS-7 cells using Phospho-FoxO1 (Thr24)/(FoxO3a (Thr32)/FoxO4 (Thr28) (4G6) Rabbit mAb to detect FoxO1, FoxO3a and FoxO4 when phosphorylated at the Thr24, Thr32, and Thr28 positions, respectively (left panel). Total FoxO1, FoxO3a and FoxO4 were detected using FoxO1 (C29H4) Rabbit mAb (#2880), FoxO3a (75D8) Rabbit mAb (#2497) and FoxO4 Antibody (#9472), respectively (right panel).
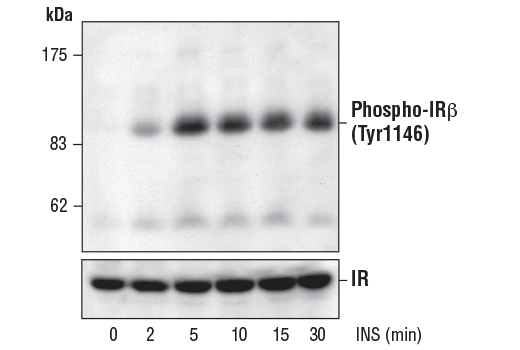
Western blot analysis of extracts from 3T3-L1 adipocytes, untreated or insulin-treated (100 nM for the indicated times), using Phospho-IGF-I Receptor β (Tyr1131)/Insulin Receptor β (Tyr1146) Antibody (upper) or control IR antibody (lower).
Revision 1
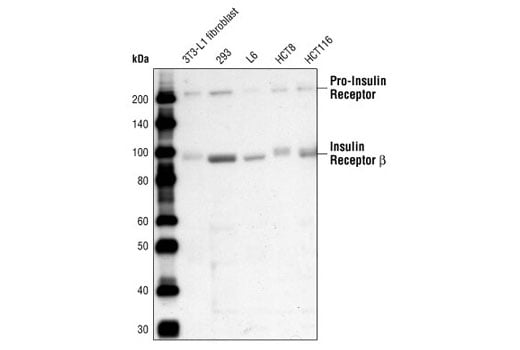
Western blot analysis of extracts from various cell lines using Insulin Receptor β (4B8) Rabbit mAb.
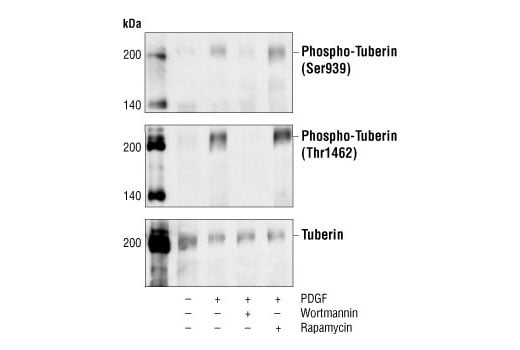
Western blot analysis of extracts from NIH/3T3 cells, untreated, PDGF-treated, and PDGF and wortmannin-treated or PDGF and rapamycin-treated, using Phospho-Tuberin/TSC2 (Ser939) Antibody (top), Phospho-Tuberin/TSC2 (Thr1462) Antibody #3611 (middle) or Tuberin/TSC2 Antibody #3612 (bottom).
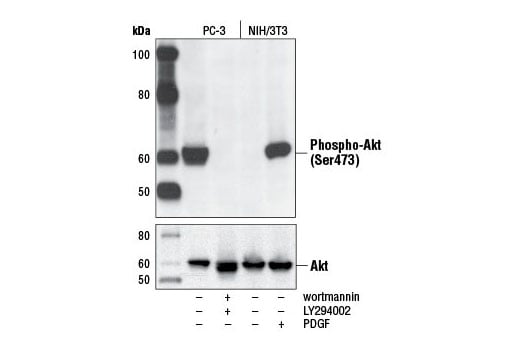
Western blot analysis of extracts from PC-3 cells, untreated or LY294002/wortmannin-treated, and NIH/3T3 cells, serum-starved or PDGF-treated, using Phospho-Akt (Ser473) (D9E) XP® Rabbit mAb (upper) or Akt (pan) (C67E7) Rabbit mAb #4691 (lower).
Revision 1
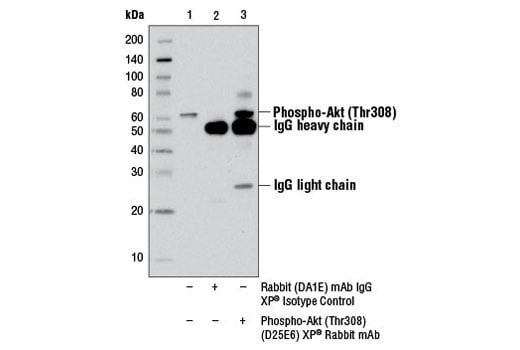
Immunoprecipitation of phospho-Akt (Thr308) from Jurkat cell extracts using Rabbit (DA1E) mAb IgG XP® Isotype Control #3900 (lane 2) or Phospho-Akt (Thr308) (D25E6) XP® Rabbit mAb (lane 3). Lane 1 is 10% input. Western blot analysis was performed using Phospho-Akt (Thr308) (D25E6) XP® Rabbit mAb.
Western blot analysis of extracts from Jurkat cells treated with either Calyculin A (#9902) or LY294002 (#9901) using Phospho-FoxO1 (Thr24)/(FoxO3a (Thr32)/FoxO4 (Thr28) (4G6) Rabbit mAb. The phospho-specificity of the antibody was verified by treating the membrane in the absence (-) or presence (-) of calf intestinal phosphatase (CIP) after western transfer.
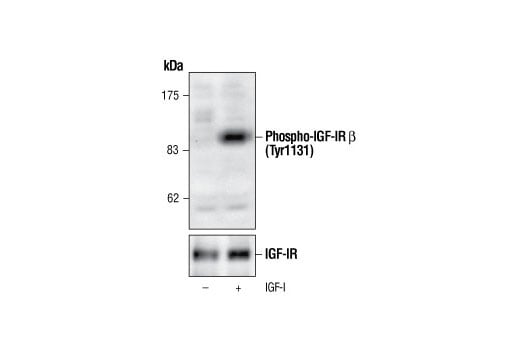
Western blot analysis of extracts from 293 cells, untreated or IGF-I-treated (100 nM for 2 minutes), using Phospho-IGF-I Receptor β (Tyr1131)/Insulin Receptor β (Tyr1146) Antibody (upper) or control IGF-I Receptor antibody (lower).
Revision 1
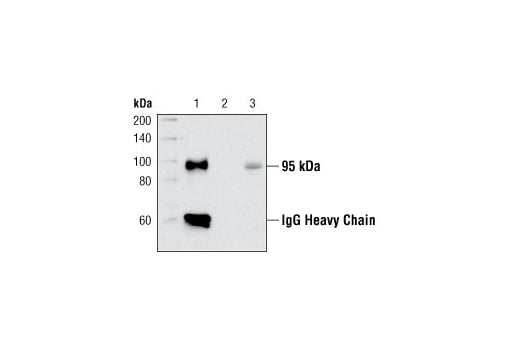
Immunprecipitation of Insulin Receptor beta from insulin treated mIMCD-3 cell extracts using Insulin Receptor beta antibody (Lane 1) Lane 2: No antibody control. Lane 3: Input control.
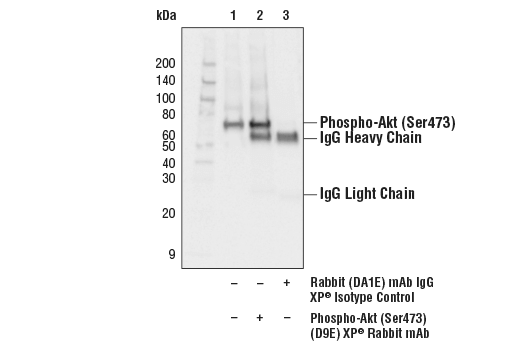
Immunoprecipitation of phospho-Akt (Ser473) from Jurkat extracts treated with Calyculin A #9902 (100nM, 30 min). Lane 1 is 10% input, lane 2 is Phospho-Akt (Ser473) (D9E) XP® Rabbit mAb, and lane 3 is Rabbit (DA1E) mAb IgG XP® Isotype Control #3900. Western blot analysis was performed with Phospho-Akt (Ser473) (D9E) XP® Rabbit mAb. Anti-rabbit IgG, HRP-linked Antibody #7074 was used as a secondary antibody.
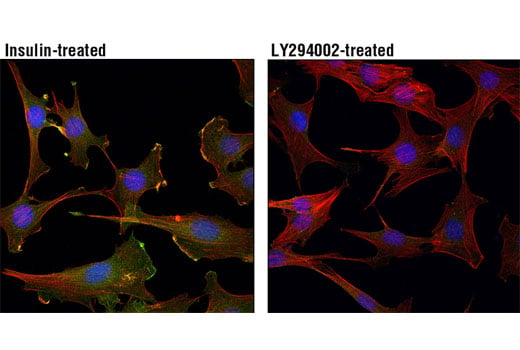
Confocal immunofluorescent analysis of C2C12 cells, insulin-treated (100 nM, 15 min; left) or treated with LY294002 #9901 (50 μM, 2 hr; right), using Phospho-Akt (Thr308) (D25E6) XP® Rabbit mAb (green). Actin filaments were labeled with DY-554 phalloidin (red). Blue pseudocolor = DRAQ5® #4084 (fluorescent DNA dye).
Revision 1
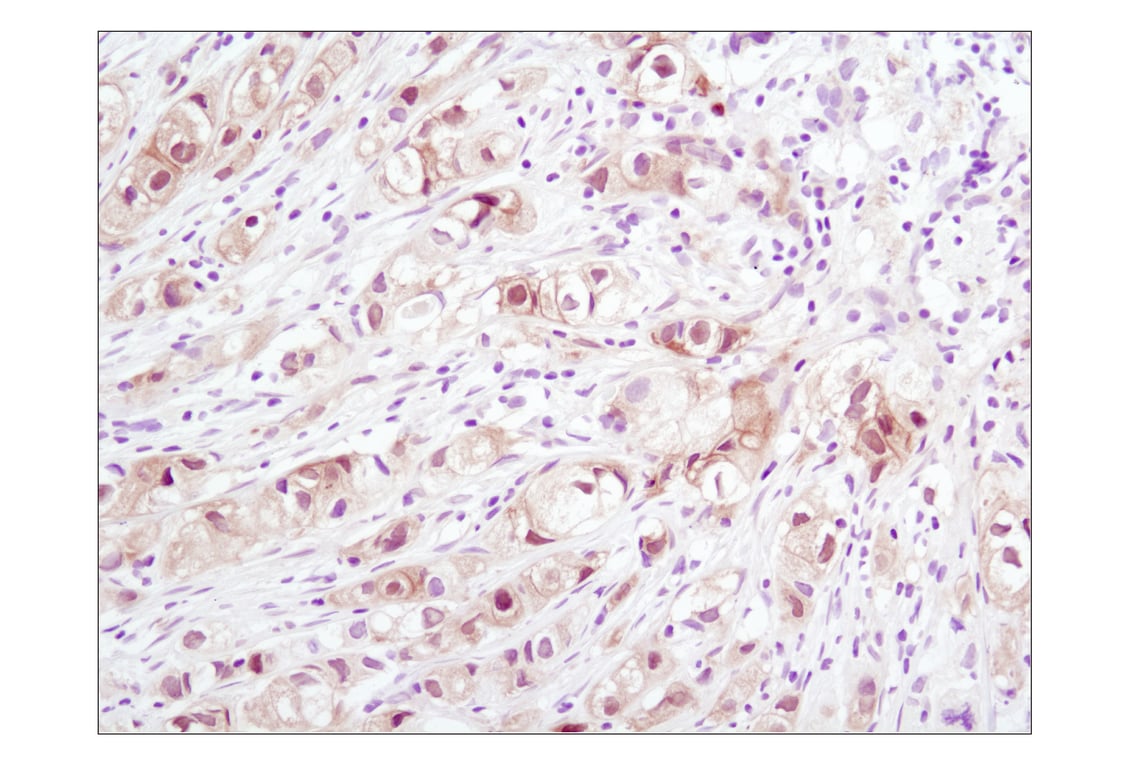
Immunohistochemical analysis of paraffin-embedded human lung carcinoma using Phospho-Akt (Ser473) (D9E) XP® Rabbit mAb.
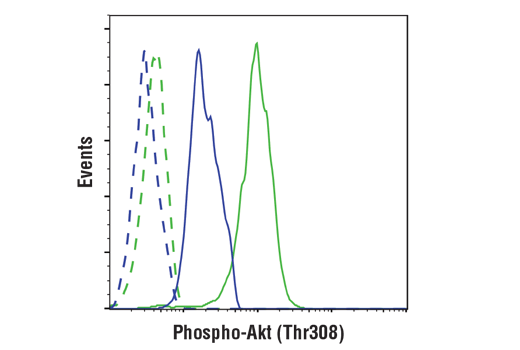
Flow cytometric analysis of Jurkat cells, untreated (green) or treated with LY294002 #9901, Wortmannin #9951 and U0126 #9903 (blue), using Phospho-Akt (Thr308) (D25E6) XP® Rabbit mAb (solid line) compared to a concentration-matched Rabbit (DA1E) mAb IgG XP® Isotype Control #3900 (dashed line). Anti-rabbit IgG (H+L), F(ab')2 Fragment (Alexa Fluor® 488 Conjugate) #4412 was used as a secondary antibody.
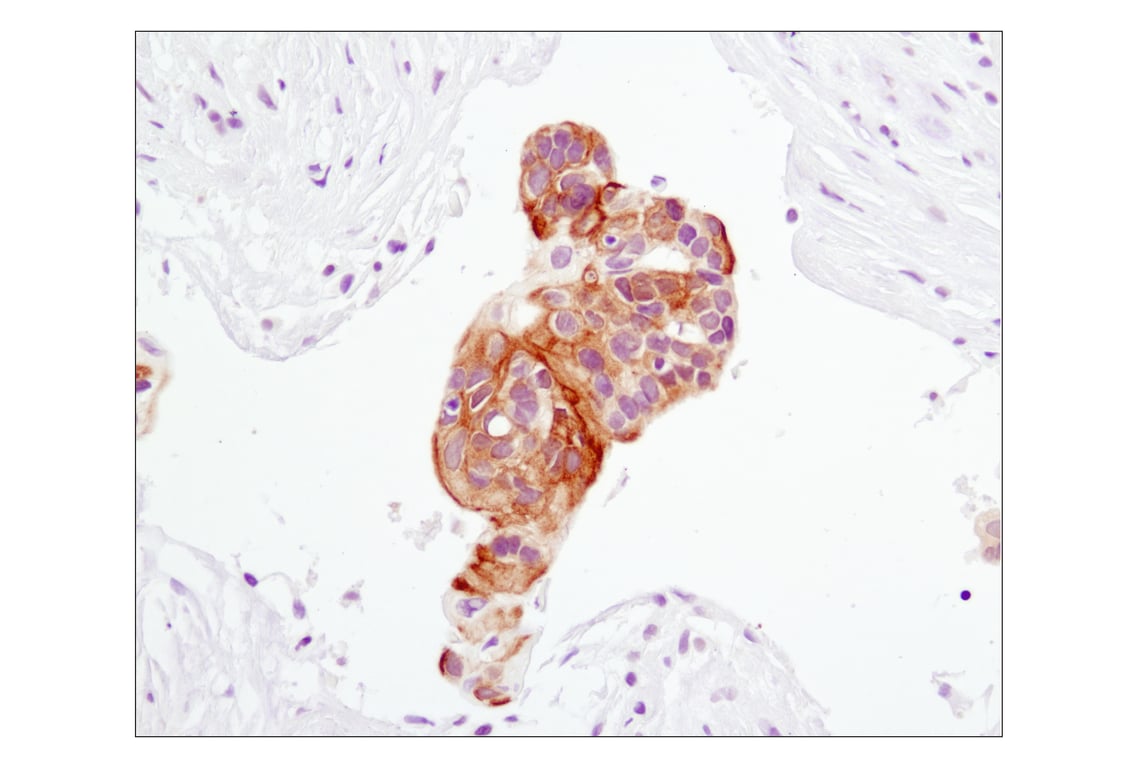
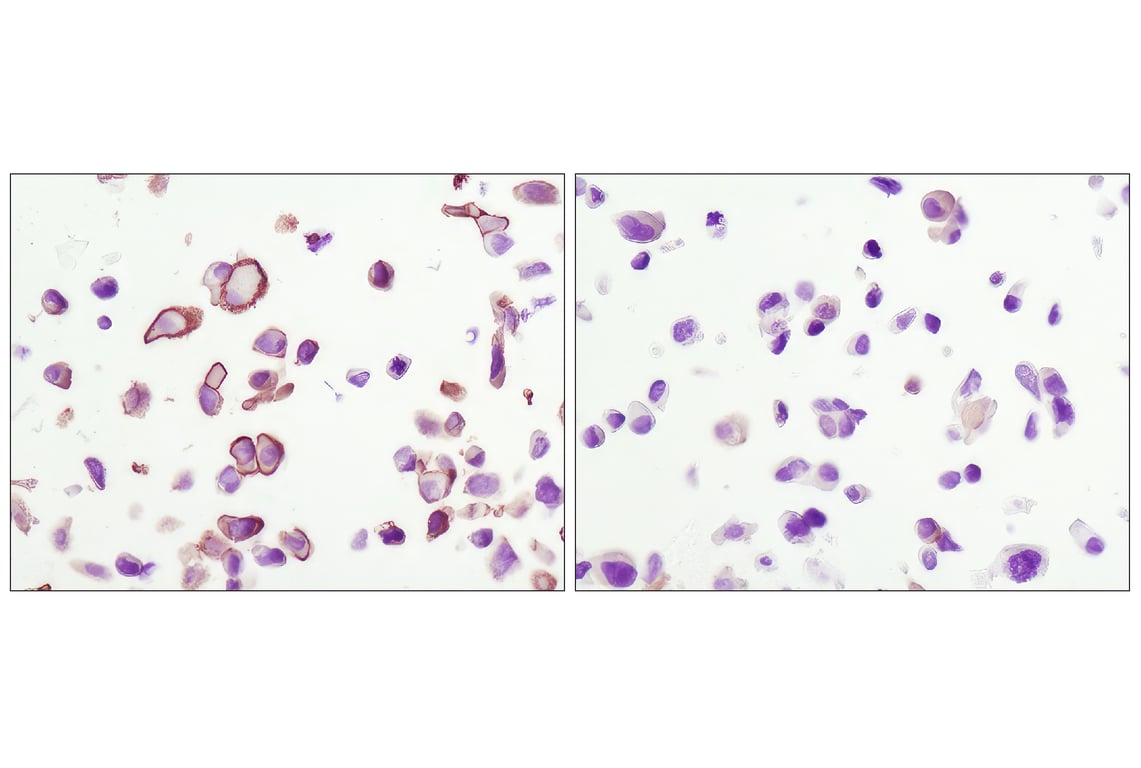
Immunohistochemical analysis of paraffin-embedded human breast carcinoma using Phospho-Akt (Ser473) (D9E) XP® Rabbit mAb.
Revision 1
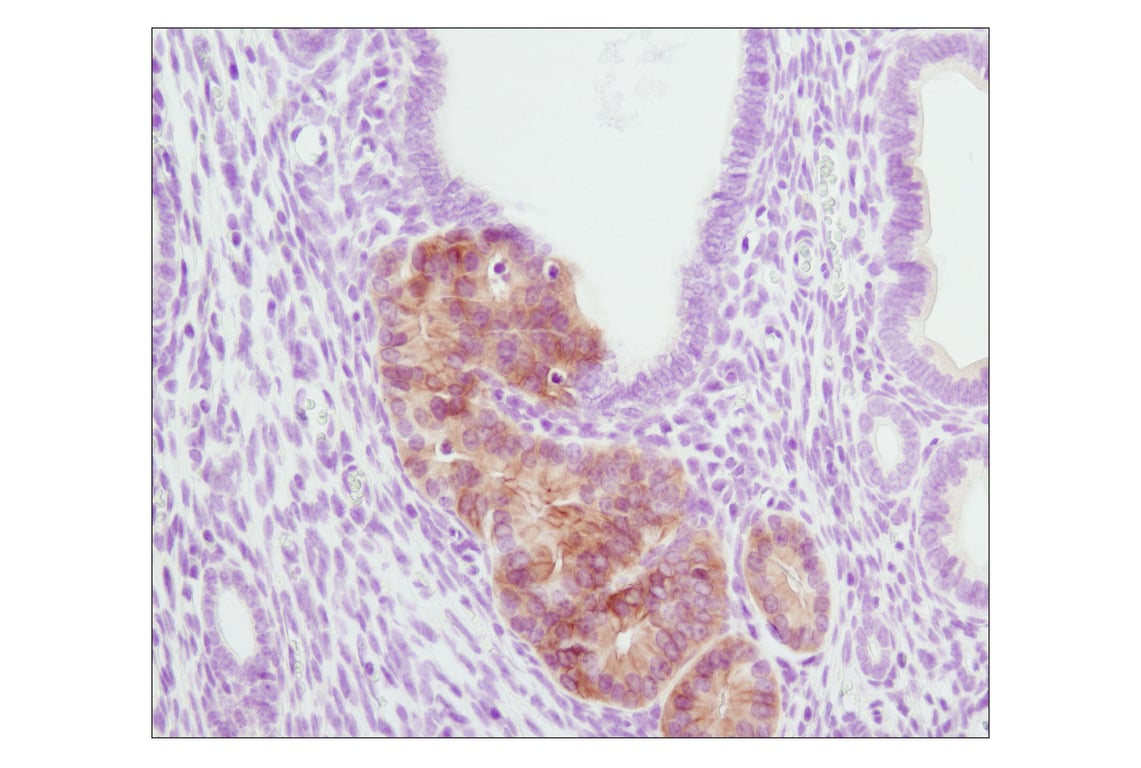
Immunohistochemical analysis of paraffin-embedded PTEN heterozygous mutant mouse endometrium using Phospho-Akt (Ser473) (D9E) XP® Rabbit mAb. (Tissue section courtesy of Dr. Sabina Signoretti, Brigham and Women's Hospital, Harvard Medical School, Boston, MA.)
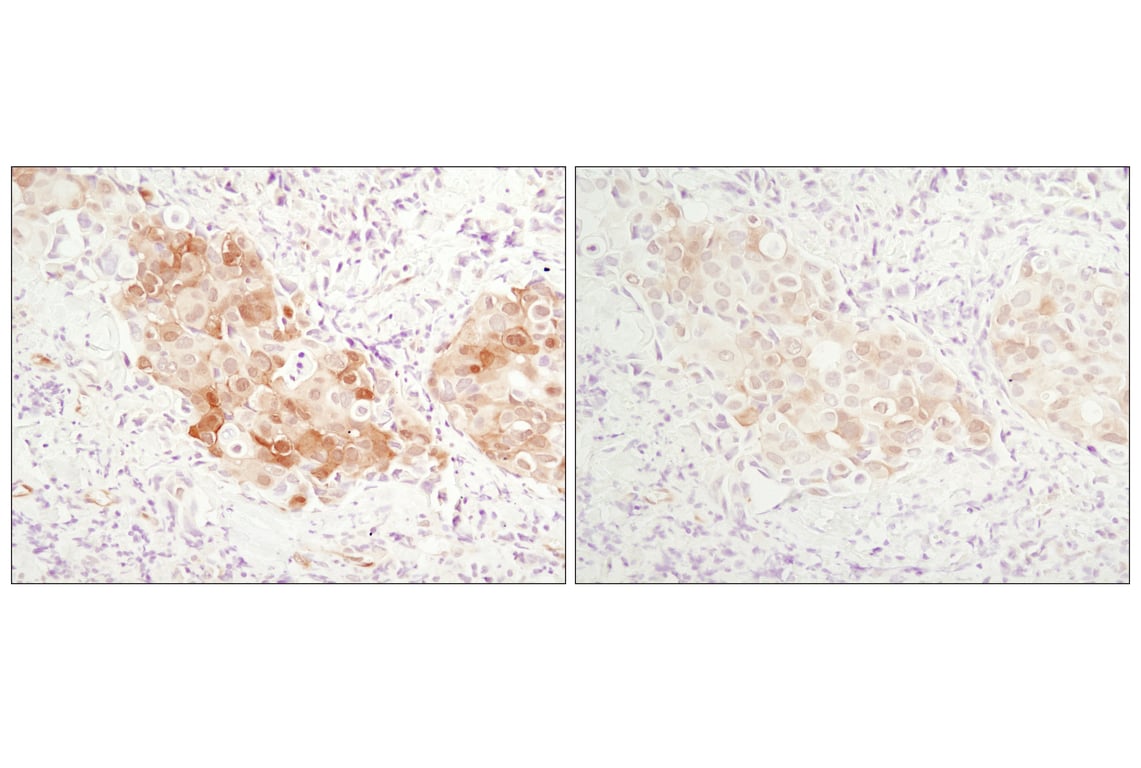
Immunohistochemical analysis of paraffin-embedded MDA-MB-468 xenograft using Phospho-Akt (Ser473) (D9E) XP® Rabbit mAb (left) or PTEN (138G6) Rabbit mAb #9559 (right). Note the presence of P-Akt staining in the PTEN deficient MDA-MB-468 cells.
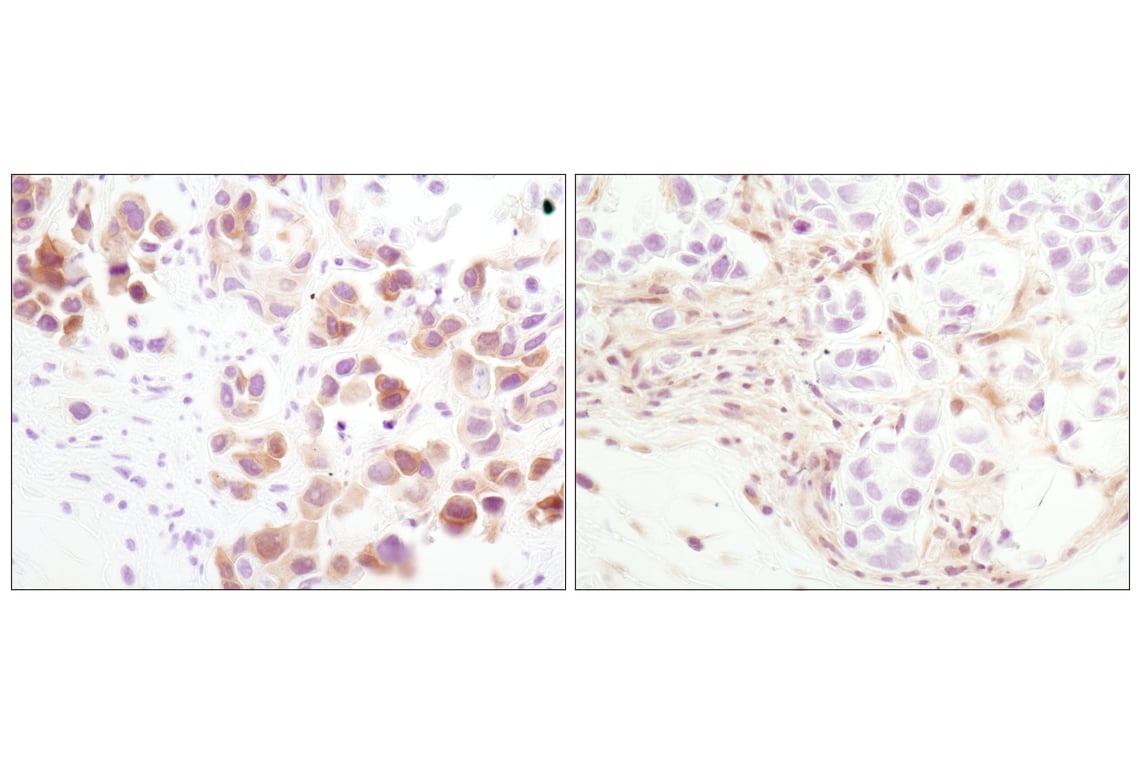
Immunohistochemical analysis of paraffin-embedded human breast carcinoma comparing SignalStain® Antibody Diluent #8112 (left) to TBST/5% normal goat serum (right) using Phospho-Akt (Ser473) (D9E) XP® Rabbit mAb #4060.
Revision 1
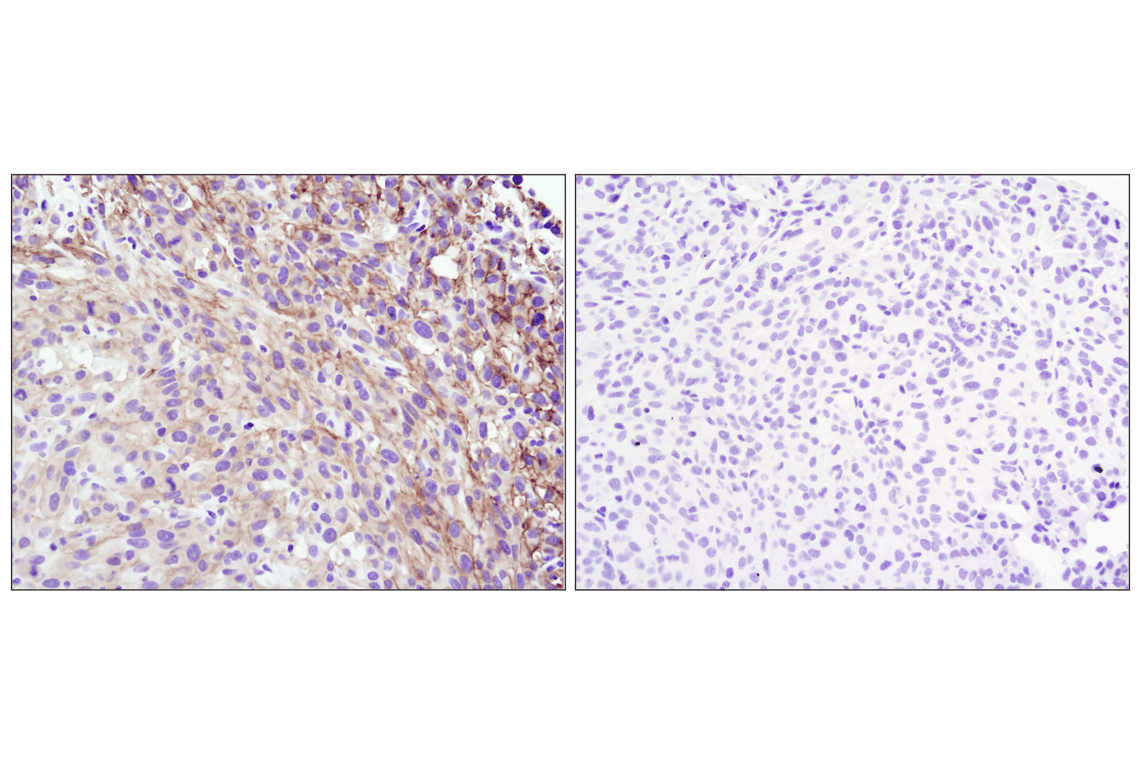
Immunohistochemical analysis of paraffin-embedded U-87MG xenograft, untreated (left) or lambda phosphatase-treated (right), using Phospho-Akt (Ser473) (D9E) XP® Rabbit mAb.
Immunohistochemical analysis using Phospho-Akt (Ser473) (D9E) XP® Rabbit mAb on SignalSlide® Phospho-Akt (Ser473) IHC Controls #8101 (paraffin-embedded LNCaP cells, untreated (left) or LY294002-treated (right)).
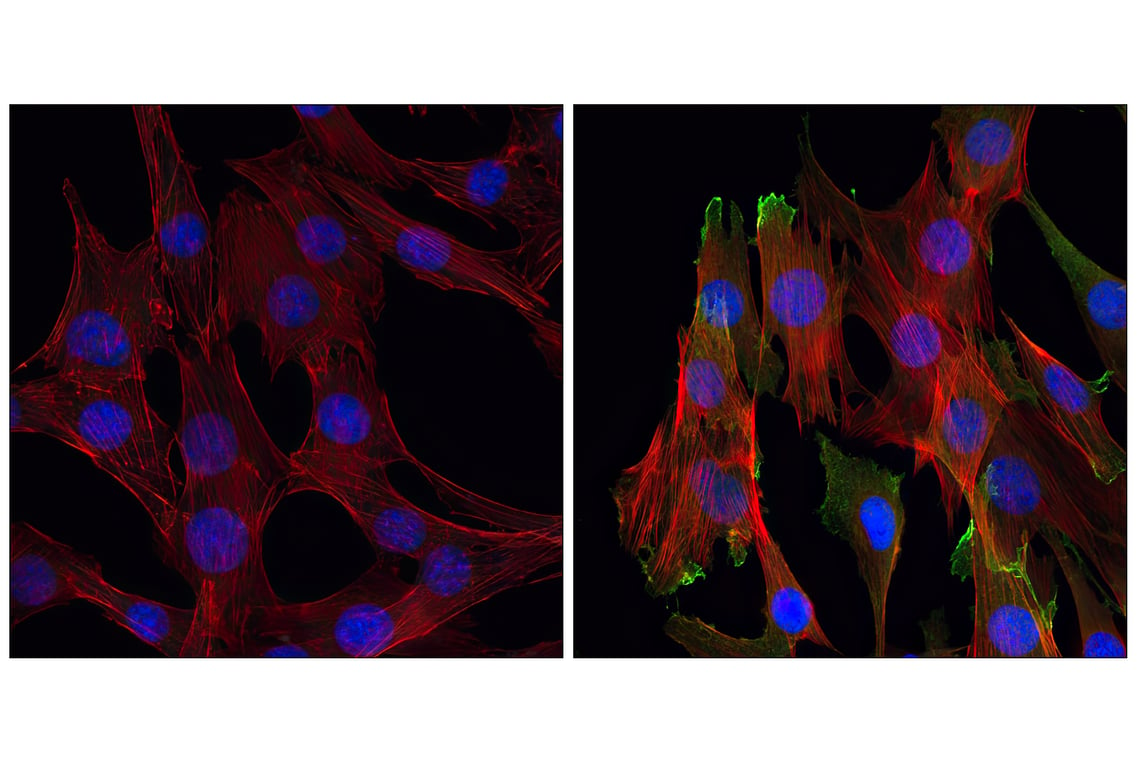
Confocal immunofluorescent analysis of C2C12 cells, LY294002-treated (left) or insulin-treated (right), using Phospho-Akt (Ser473) (D9E) XP® Rabbit mAb (green). Actin filaments have been labeled with Alexa Fluor® 555 phalloidin #8953 (red). Blue pseudocolor = DRAQ5®#4084 (fluorescent DNA dye).
Revision 1
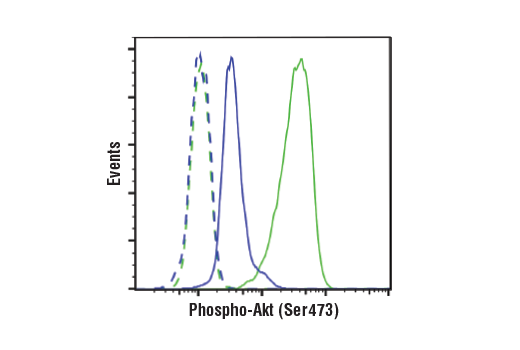
Flow cytometric analysis of Jurkat cells, untreated (green) or treated with LY294002 #9901, Wortmannin #9951, and U0126 #9903 (50 μM, 1 μM, and 10 μM, 2 hr; blue) using Phospho-Akt (Ser473) (D9E) XP® Rabbit mAb (solid lines) or concentration-matched Rabbit (DA1E) mAb IgG XP® Isotype Control #3900 (dashed lines). Anti-rabbit IgG (H+L), F(ab')2 Fragment (Alexa Fluor® 488 Conjugate) #4412 was used as a secondary antibody.
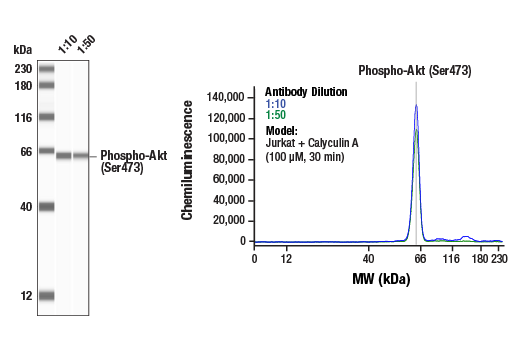
Simple Western™ analysis of lysates (0.1 mg/mL) from Jurkat cells treated with Calyculin A (100 uM, 30 min) using Phospho-Akt (Ser473) (D9E) XP® Rabbit mAb #4060. The virtual lane view (left) shows a single target band (as indicated) at 1:10 and 1:50 dilutions of primary antibody. The corresponding electropherogram view (right) plots chemiluminescence by molecular weight along the capillary at 1:10 (blue line) and 1:50 (green line) dilutions of primary antibody. This experiment was performed under reducing conditions on the Jess™ Simple Western instrument from ProteinSimple, a BioTechne brand, using the 12-230 kDa separation module.
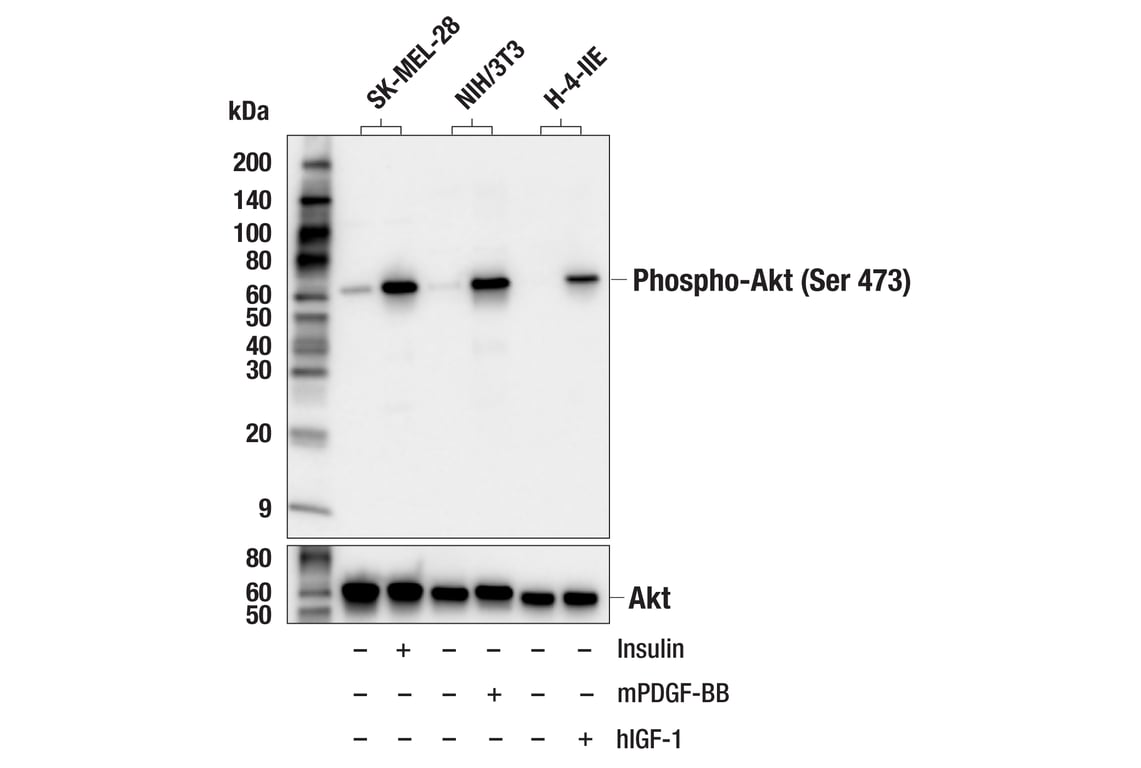
Western blot analysis of extracts from various cell lines, untreated (-) or treated (+) as indicated with human insulin (100 nM, 20 min), mouse PDGF-BB (100 ng/ml, 20 min), or human Insulin-like Growth Factor I (hIGF-I) #8917 (100 ng/ml; 5 min), using Phospho-Akt (Ser473) (D9E) XP® Rabbit mAb (upper) or Akt (pan) (C67E7) Rabbit mAb #4691 (lower).
Revision 1
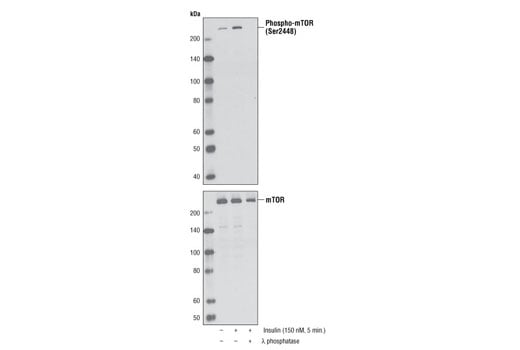
Western blot analysis of extracts from serum-starved NIH/3T3 cells, untreated or insulin-treated (150 nM, 5 minutes), alone or in combination with λ-phosphatase, using Phospho-mTOR (Ser2448) (D9C2) XP® Rabbit mAb (upper) or mTOR (7C10) Rabbit mAb #2983.
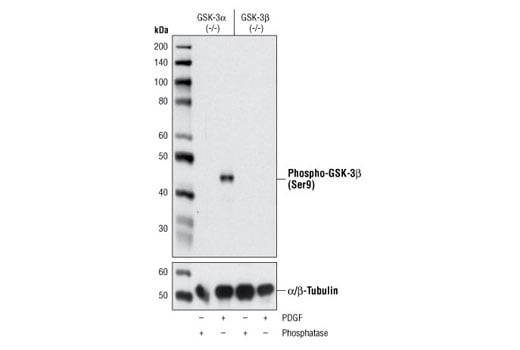
Western blot analysis of extracts from GSK-3α (-/-) (lanes 1,2) and GSK-3β (-/-) (lanes 3,4) mouse embryonic fibroblast (MEF) cells, λ phosphatase or PDGF-treated, using Phospho-GSK-3β (Ser9) (D85E12) XP® Rabbit mAb (upper) and α/β-Tubulin Antibody #2148 (lower). (MEF wild type, GSK-3α (-/-) and GSK-3β (-/-) cells were kindly provided by Dr. Jim Woodgett, University of Toronto, Canada).
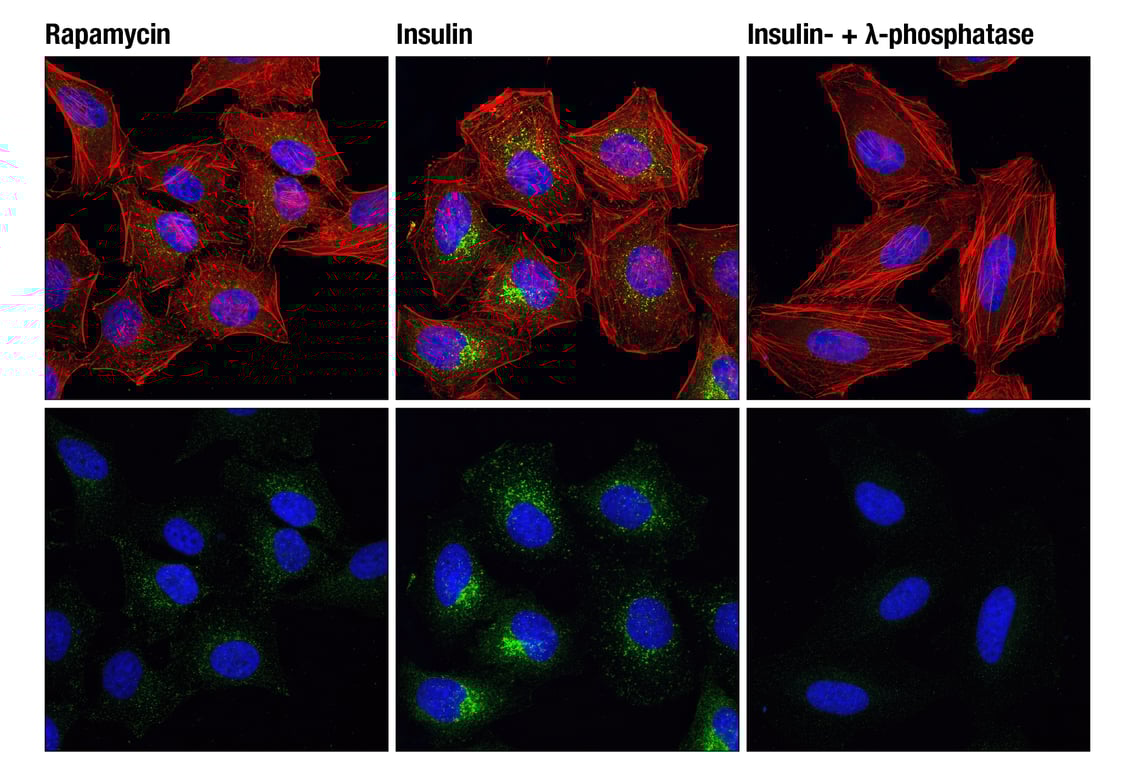
Confocal immunofluorescent analysis of HeLa cells, rapamycin-treated (#9904, 10 nM for 2 hours, left), insulin-treated (150 nM for 6 minutes, middle) or insulin- and λ-phosphatase-treated (right), using Phospho-mTOR (Ser2448) (D9C2) XP® Rabbit mAb (green). Actin filaments were labeled with DY-554 phalloidin. Blue pseudocolor = DRAQ5® #4084 (fluorescent DNA dye).
Revision 1
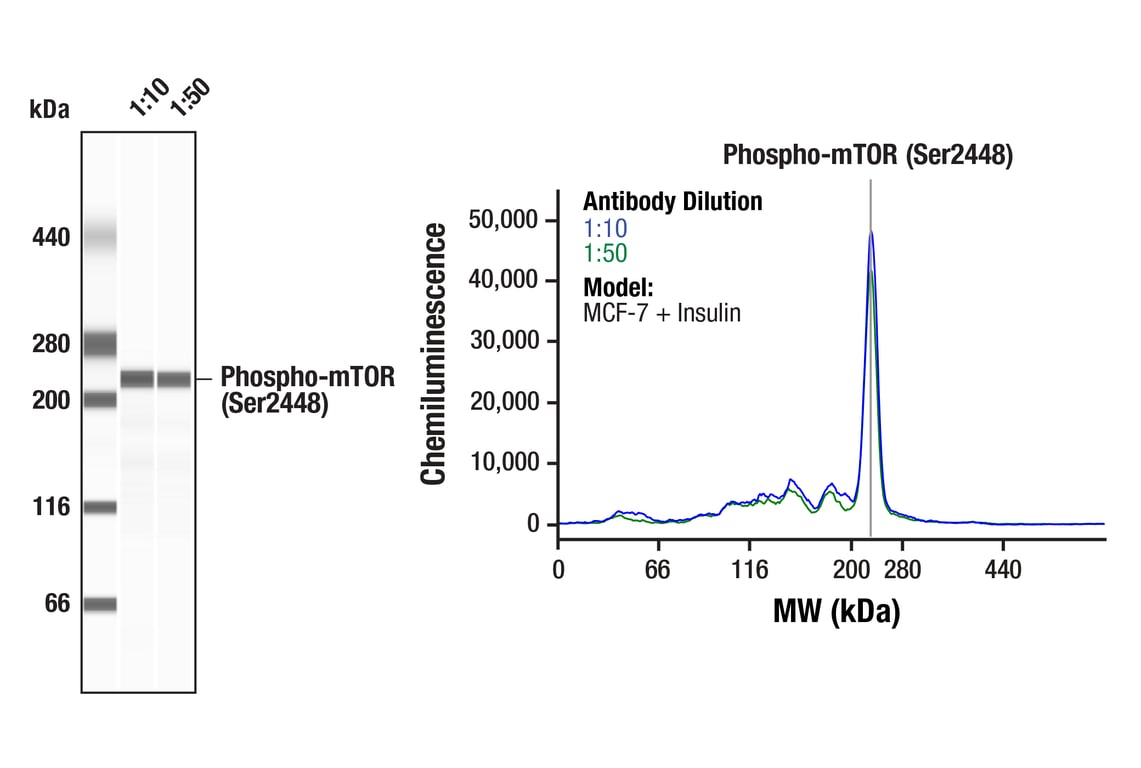
Simple WesternTM analysis of lysates (0.1 mg/mL) from MCF-7 cells treated with insulin (100nM, 10 minutes) using Phospho-mTOR (Ser2448) (D9C2) XP® Rabbit mAb #5536. The virtual lane view (left) shows a single target band (as indicated) at 1:10 and 1:50 dilutions of primary antibody. The corresponding electropherogram view (right) plots chemiluminescence by molecular weight along the capillary at 1:10 (blue line) and 1:50 (green line) dilutions of primary antibody. This experiment was performed under reducing conditions on the JessTM Simple Western instrument from ProteinSimple, a BioTechne brand, using the 66-440 kDa separation module.
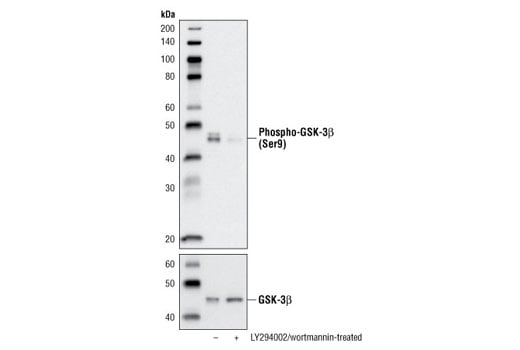
Western blot analysis of extracts from PC-3 cells, untreated or LY294002/wortmannin-treated, using Phospho-GSK-3β (Ser9) (D85E12) XP® Rabbit mAb (upper) or GSK-3β (27C10) Rabbit mAb #9315 (lower).
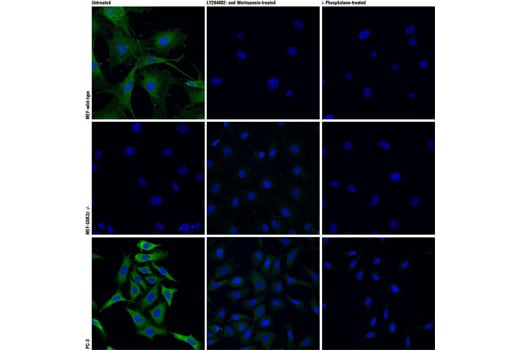
Confocal immunofluorescent analysis of wild type mouse embryonic fibroblasts (MEFs) (top row), GSK-3β (-/-) MEFs (middle row) , or PC-3 cells (bottom row), untreated (left), LY294002- and Wortmannin-treated (#9901 and #9951 respectively; center) or lambda phosphatase-treated (right), using Phospho-GSK-3β (Ser9) (D85E12) XP® Rabbit mAb (green). Actin filaments were labeled with DY-554 phalloidin (red). Blue pseudocolor = DRAQ5® #4084 (fluorescent DNA dye). (MEF wild type and GSK-3β (-/-) cells were kindly provided by Dr. Jim Woodgett, University of Toronto, Canada).
Revision 1
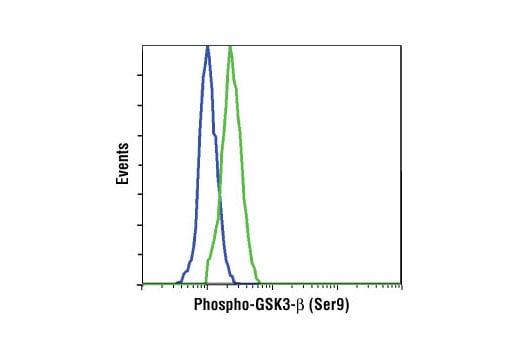
Flow cytometric analysis of NIH/3T3 cells, untreated (blue) or PDGF-treated (green), using Phospho-GSK-3β (Ser9) (D85E12) XP® Rabbit mAb.
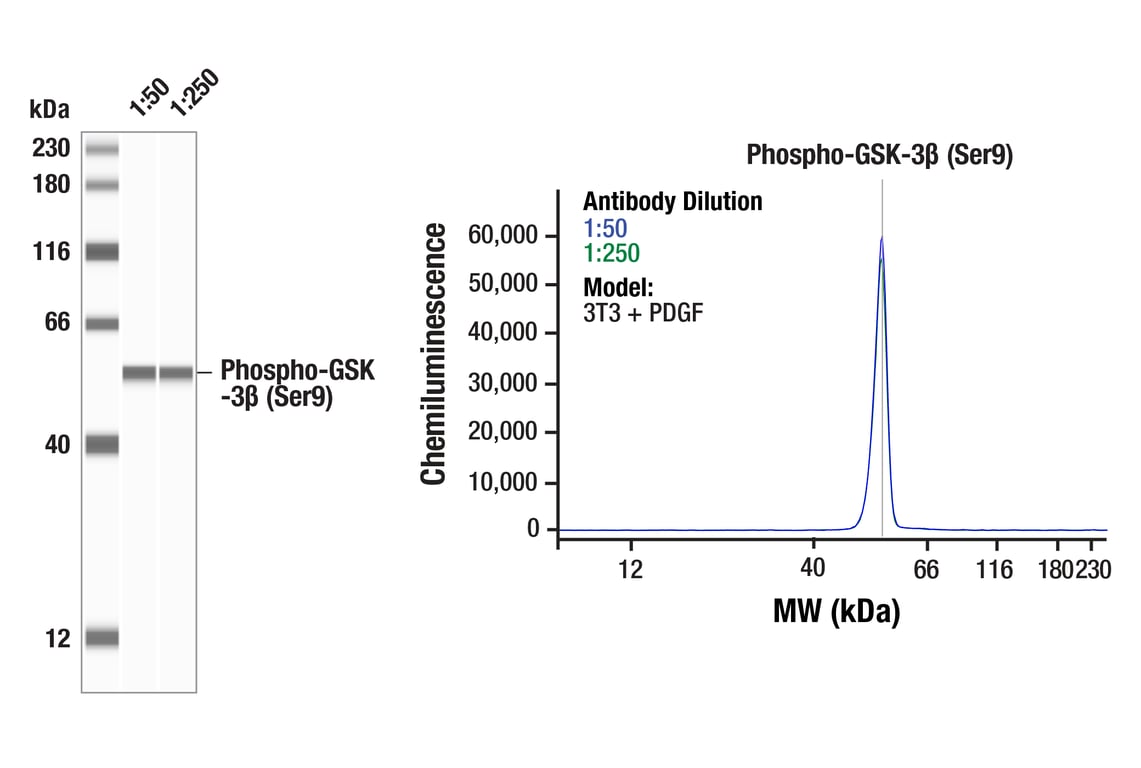
Simple Western™ analysis of lysates (0.1 mg/mL) from PDGF-treated 3T3 cells using Phospho-GSK-3β (Ser9) (D85E12) XP® Rabbit mAb #5558. The virtual lane view (left) shows the target band (as indicated) at 1:50 and 1:250 dilutions of primary antibody. The corresponding electropherogram view (right) plots chemiluminescence by molecular weight along the capillary at 1:50 (blue line) and 1:250 (green line) dilutions of primary antibody. This experiment was performed under reducing conditions on the Jess™ Simple Western instrument from ProteinSimple, a BioTechne brand, using the 12-230 kDa separation module.
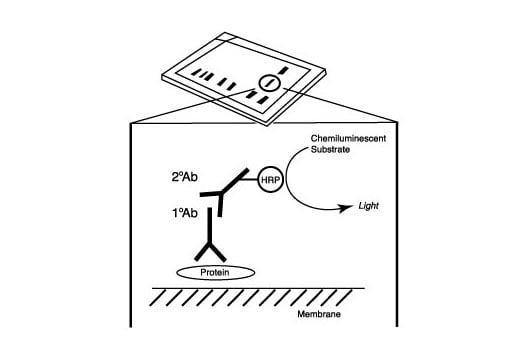
After the primary antibody is bound to the target protein, a complex with HRP-linked secondary antibody is formed. The LumiGLO® is added and emits light during enzyme catalyzed decomposition.
Revision 1
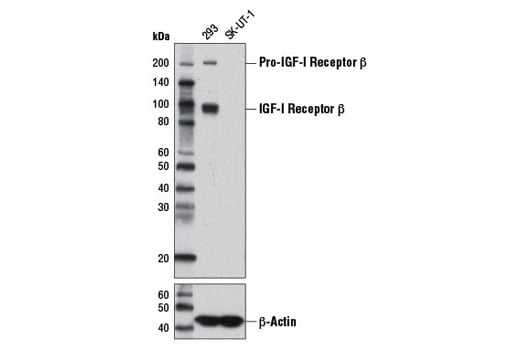
Western blot analysis of extracts from 293 (IGF-I receptor β+) and SK-UT-1 (IGF-I receptor β-) cells using IGF-I Receptor β (D23H3) XP® Rabbit mAb (upper) or β-Actin Antibody #4967 (lower).
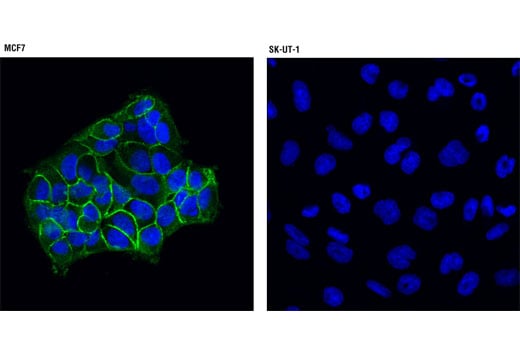
Confocal immunofluorescent analysis of MCF7 (left) and SK-UT-1 (right) cells using IGF-I Receptor β (D23H3) XP® Rabbit mAb (green). Blue pseudocolor = DRAQ5® #4084 (fluorescent DNA dye).
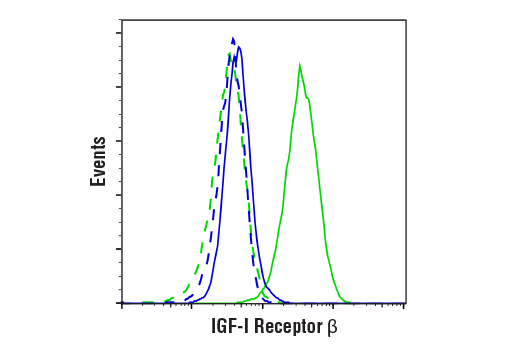
Flow cytometric analysis of fixed and permeabilized SK-UT-1 cells (blue, negative) and MCF7 cells (green, positive) using IGF-I Receptor β (D23H3) XP® Rabbit mAb (solid lines) or a concentration-matched Rabbit (DA1E) mAb IgG XP® Isotype Control #3900 (dashed lines). Anti-rabbit IgG (H+L), F(ab')2 Fragment (Alexa Fluor® 488 Conjugate) #4412 was used as a secondary antibody.